
The smartest WolframAlpha alternative is the one that matches your task: use Symbolab for step-by-step algebra, GeoGebra for visual math, SageMath for serious computation, and Google Data Commons for public data questions. WolframAlpha has been around since 2009, and it is still excellent for quick computed answers [source: WolframAlpha]. But it is not always the fastest, clearest, or cheapest option for every problem.
TLDR: If you solve homework equations, start with Symbolab or Microsoft Math Solver. If you need graphs, geometry, or teaching visuals, use GeoGebra or Desmos. For data work, try Google Data Commons; for harder computation, use SageMath. Example: a student checking 20 integration problems could use Symbolab for steps, then GeoGebra to confirm the graph in under 30 minutes instead of bouncing between five random calculators.
1. Symbolab: best for step-by-step equation solving
Symbolab is one of the closest WolframAlpha alternatives for math students. It handles algebra, calculus, trigonometry, differential equations, matrices, and more. The real draw is the way it breaks a problem into steps.
Type in something like solve x² – 5x + 6 = 0, and you get the answer with the method. That makes it useful for checking work, not just copying results. It drives me crazy that some math tools give the final answer and act like that is enough. Symbolab is better when you need to see the path.
- Best for: algebra, calculus, homework checks
- Weak spot: many detailed steps sit behind a paid plan
- Good alternative to: WolframAlpha’s math solver
2. Microsoft Math Solver: best free option for students
Microsoft Math Solver is simple, free, and surprisingly useful. You can type a problem, draw it, or scan it with a phone camera. It then gives steps, graphs, and related learning material.
It is especially good for high school and early college math. The interface feels lighter than WolframAlpha. You do not need to learn special input rules just to get started.
- Best for: quick math help, phone scanning, basic graphs
- Weak spot: not ideal for advanced symbolic work
- Nice touch: it often suggests videos and related examples
3. GeoGebra: best for graphs, geometry, and visual learning
GeoGebra is less of an answer engine and more of a visual math workspace. That is a good thing. It shines when you need to understand what an equation means, not just what it equals.
Use it for graphing functions, exploring sliders, testing geometry, building proofs, or showing how a parameter changes a curve. Teachers love it for a reason. It makes abstract math feel less frozen.
- Best for: graphing, geometry, classroom demos
- Weak spot: not built for broad factual questions
- Try it for: visualizing y = ax² + bx + c with sliders
4. Desmos: best for fast graphing
Desmos is the tool you open when you want a graph now. No clutter. No setup. Just type a function and watch it appear.
It is excellent for inequalities, systems of equations, regressions, and classroom activities. Compared with WolframAlpha, Desmos feels faster for pure graphing. The catch is that it will not explain broad science or engineering questions in the same way.
- Best for: graphing, sliders, regressions
- Weak spot: limited symbolic explanations
- Use case: comparing three functions on one clean graph

5. SageMath: best for serious computation
SageMath is a powerful open-source math system. It combines many math libraries into one environment, including tools for algebra, number theory, calculus, statistics, and linear algebra.
This is not the friendliest pick for a middle school equation. It is better for users who want deep control. If WolframAlpha feels too boxed in, SageMath gives you room to build and test your own computations.
- Best for: advanced math, research, symbolic computation
- Weak spot: steeper learning curve
- Useful format: SageMathCell for quick browser-based tests
6. Google Data Commons: best for public data questions
Google Data Commons is a strong choice when your question involves real-world data. Ask about population, emissions, income, health, education, or economics, and it can pull structured public data into charts and maps.
For example, you can compare unemployment rates between two regions or check population changes over time. Data Commons combines public datasets from sources such as the U.S. Census and World Bank [source: Data Commons]. That makes it more useful than a plain search when you need numbers, not opinions.
- Best for: demographic data, economics, public statistics
- Weak spot: not meant for symbolic math
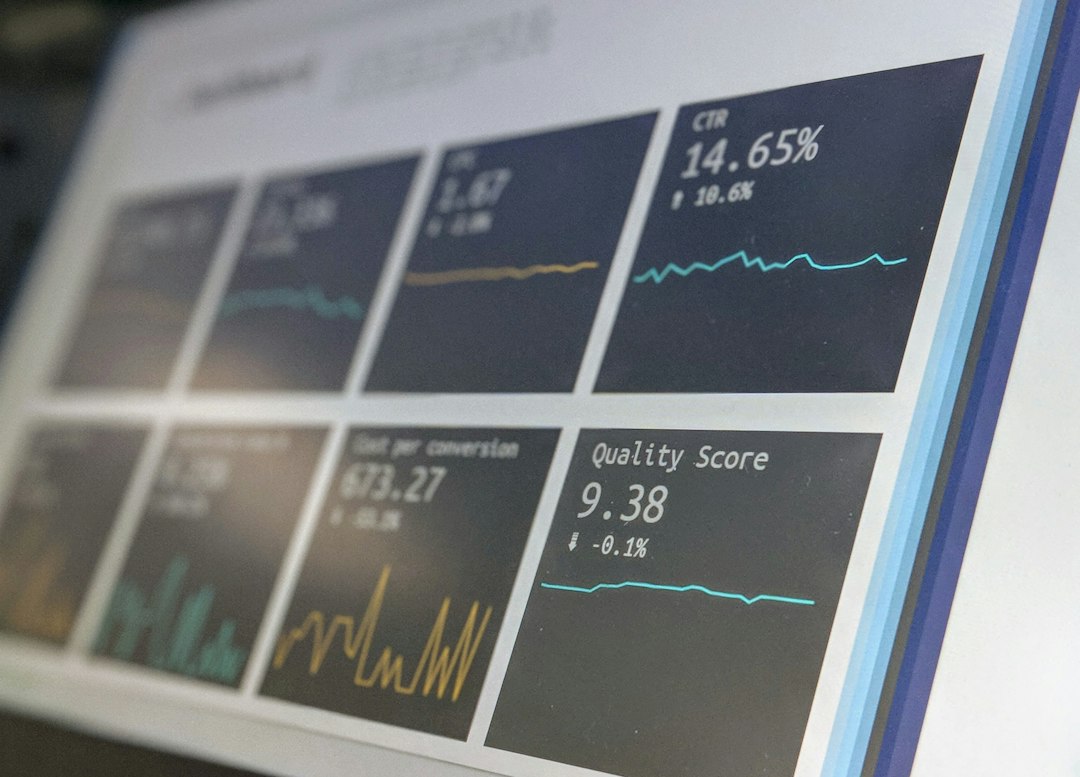
- Great for: reports, dashboards, quick comparisons
Which one should you choose?
Pick Symbolab if you want math steps. Pick Microsoft Math Solver if you want a free student-friendly tool. Pick GeoGebra or Desmos if graphs matter most. Pick SageMath if you need advanced computation. Pick Google Data Commons when the question starts with “how many,” “which country,” or “what changed over time.”
WolframAlpha is still a strong general tool. But these six alternatives often feel sharper for specific jobs. The best setup is simple: keep two or three of them handy, then use the one that gives the clearest answer with the least friction.