
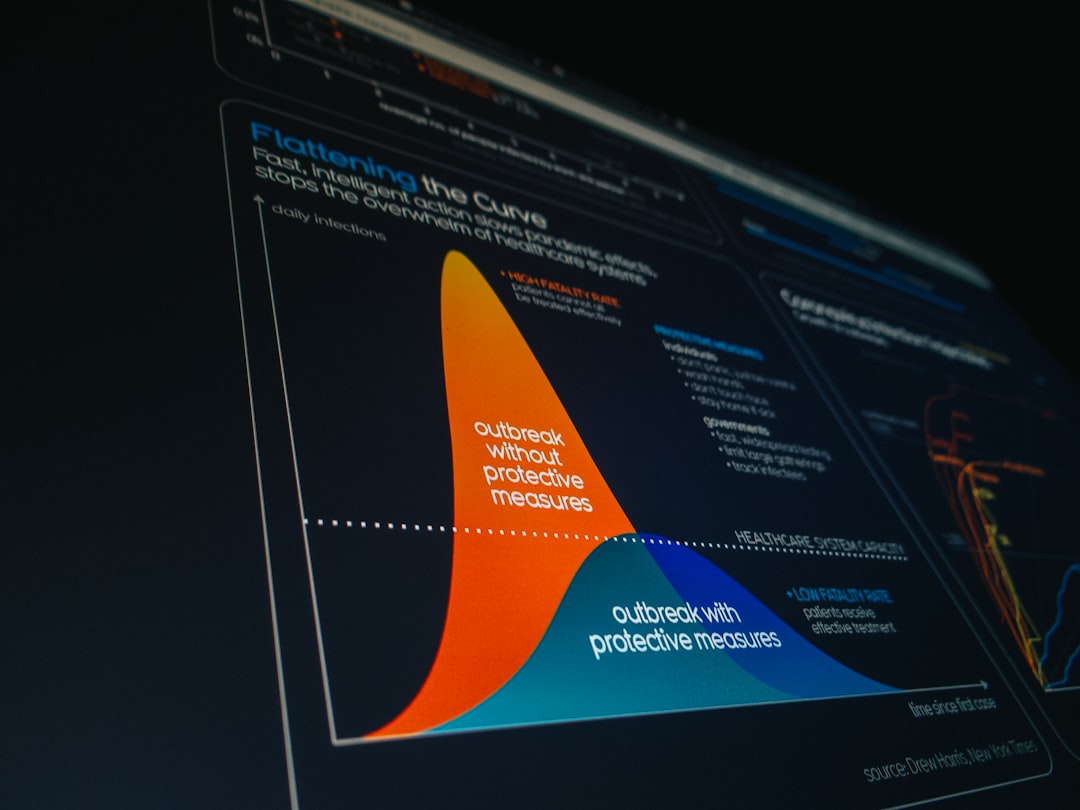
Infographics turn boring facts into bright little stories. They help people understand numbers, steps, ideas, and trends fast. The good news is this. You do not need to be a designer anymore. With the right AI infographic tool, you can make something clean, clever, and professional in minutes.
TLDR: The best AI tools for creating professional infographics are easy to use, quick, and full of smart templates. Canva, Visme, Piktochart, Venngage, Adobe Express, Infogram, Napkin AI, and Microsoft Designer are great choices. Pick Canva for speed, Visme for business content, Infogram for data, and Napkin AI for turning text into visuals. Start with a clear message, then let AI help with layout, colors, charts, and icons.
Why Use AI for Infographics?
Making an infographic used to feel scary. You needed design skills. You needed software. You needed patience. Lots of patience.
Now AI can help with the hard parts. It can suggest layouts. It can write headings. It can turn raw text into visual sections. It can pick colors that do not fight each other. That alone is magic.
AI tools are also great when you are stuck. You can type a simple prompt like, “Create an infographic about healthy sleep habits for office workers.” The tool can then build a design draft. You edit it. You polish it. You look like a design genius.
Here is what AI can help you do:
- Choose a layout that matches your idea.
- Summarize long text into short points.
- Create charts from numbers.
- Suggest icons for each section.
- Pick colors that look professional.
- Resize designs for social media, blogs, or reports.
1. Canva
Canva is one of the easiest tools for making infographics. It is friendly. It is bright. It feels like a design playground. But a very organized playground.
Canva has tons of infographic templates. You can search by topic, style, size, or color. Its AI features help with text, images, layout ideas, and quick edits. You can use Magic Write to create short copy. You can use AI image tools to create graphics. You can also remove backgrounds and resize designs fast.
Canva is best for:
- Beginners who want fast results.
- Social media infographics.
- School projects.
- Blog graphics.
- Simple business visuals.
The best part is how easy it feels. Drag. Drop. Edit. Done. If you can make a sandwich, you can make an infographic in Canva.
2. Visme
Visme is great for business infographics. It feels more polished and corporate than some other tools. That is not a bad thing. Sometimes your infographic needs to wear a nice jacket.
Visme gives you templates for reports, presentations, timelines, process charts, and data visuals. Its AI tools can help you generate first drafts from prompts. You can also create charts, add brand colors, and use animated elements.
Visme is strong when your infographic needs to explain something serious. Think sales reports, training guides, investor updates, or market research.
Use Visme if you want:
- Professional templates for business content.
- Charts and graphs that look clean.
- Brand kits for consistent design.
- Interactive elements for online sharing.
It is a smart pick for teams. It helps everyone make visuals that look like they came from the same brand planet.
3. Piktochart
Piktochart is built for infographics. That is its home field. It is simple, clear, and very useful for turning data or text into visual stories.
Piktochart has AI features that can create infographic drafts from a prompt. You can describe your topic, choose a style, and get a starting design. Then you can edit the text, change icons, and add charts.
This tool is excellent for education, nonprofits, internal reports, and marketing. It does not make you feel lost. That matters. A tool should not require a treasure map.
Piktochart is best for:
- Step by step guides.
- Educational infographics.
- Simple data storytelling.
- Reports with charts.
- Posters and one page summaries.
If your goal is to explain something clearly, Piktochart is a very safe choice.

4. Venngage
Venngage is another popular tool made for infographics. It is especially useful for businesses, teachers, marketers, and HR teams.
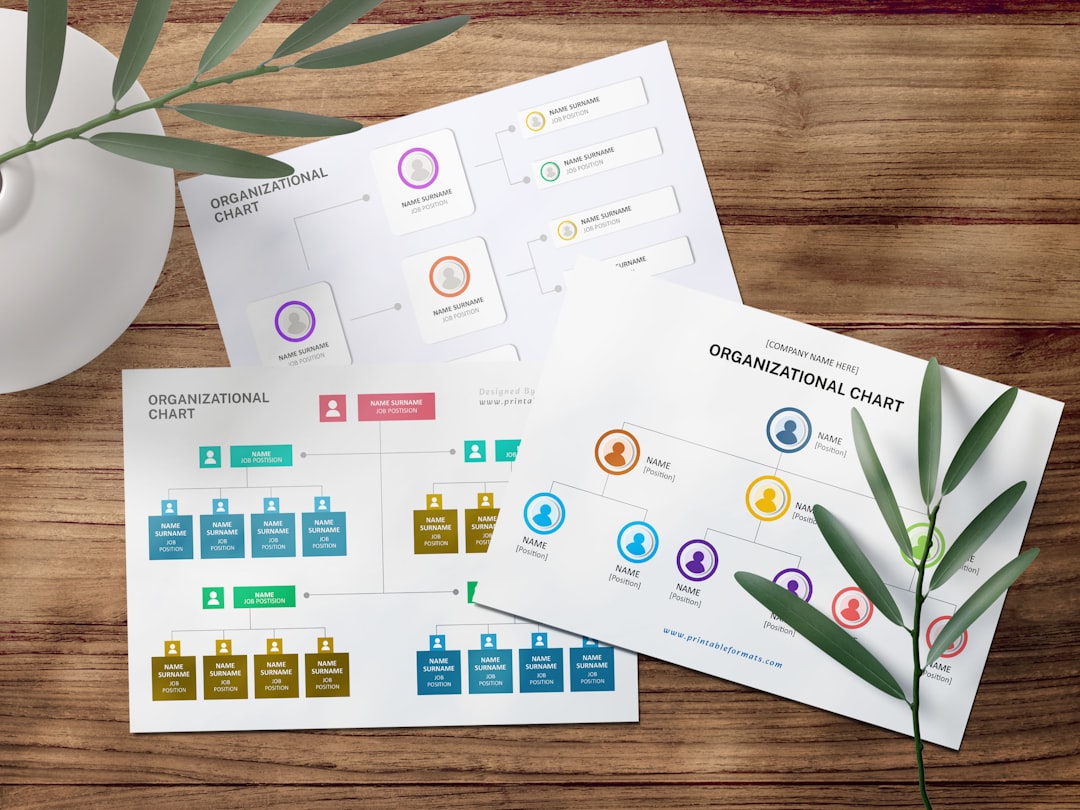
Venngage offers many templates for timelines, comparison charts, process maps, statistics, and checklists. Its AI tools can help create designs from prompts. It also includes smart editing features that make the design process smoother.
Venngage does a nice job with structure. That means your infographic will not look like a messy drawer. It helps keep sections balanced. It helps your viewer move from top to bottom without getting confused.
Venngage is best for:
- Process infographics with clear steps.
- Comparison infographics with two or more choices.
- HR and training visuals for teams.
- Marketing graphics with strong layouts.
It is a good tool when you need something clean, structured, and easy to present.
5. Adobe Express
Adobe Express is like the friendly cousin of professional design software. It is much easier than complex design apps. But it still has strong creative power.
Adobe Express includes templates, quick actions, text effects, image generation, background removal, and brand controls. Its AI features can help you create graphics and design assets in seconds.
This tool is great if you want stylish visuals. It is also good if you already use other Adobe products. Everything feels connected.
Adobe Express is best for:
- Modern marketing graphics.
- Social media infographics.
- Creative visual content.
- Branded designs.
- Quick edits and image effects.
If Canva is the fun design playground, Adobe Express is the trendy art studio. Both are useful. One may fit your style better.
6. Infogram
Infogram is perfect for data lovers. If your infographic has lots of numbers, charts, maps, or statistics, look here first.
Infogram helps you make professional data visualizations. You can create bar charts, line charts, pie charts, maps, dashboards, and reports. It is especially useful for newsrooms, analysts, marketers, and business teams.
AI can help with data storytelling. But you still need clean data. Bad data makes bad charts. That is the law of the graph jungle.
Infogram is best for:
- Data heavy infographics.
- Interactive charts.
- Maps and dashboards.
- Reports with live updates.
If your story depends on numbers, Infogram is a strong choice. It makes data easier to see and easier to trust.
7. Napkin AI
Napkin AI is different. It turns text into visuals. That sounds simple. But it can feel amazing.
You paste in text, notes, or ideas. Napkin AI finds the key points. Then it creates visual diagrams, flowcharts, and simple infographic style layouts. It is very useful when you have an idea but no design plan.
Napkin AI is great for brainstorming. It helps you see the shape of your thoughts. That is useful for blog posts, presentations, strategy docs, and learning materials.
Napkin AI is best for:
- Turning notes into visuals.
- Creating simple concept maps.
- Building flowcharts fast.
- Explaining ideas in meetings.
- Finding structure in messy text.
It may not replace a full design tool for every project. But it is fantastic for starting fast.
8. Microsoft Designer
Microsoft Designer is a clean and simple AI design tool. It helps you create graphics from prompts. You type what you need. It suggests designs. Then you edit them.
It works well for quick marketing graphics, social posts, headers, and simple visual summaries. It also connects nicely with the Microsoft world. That can be handy if you already use Microsoft tools every day.
Microsoft Designer is best for:
- Quick AI generated designs.
- Simple infographics for work.
- Social media graphics.
- Promotional visuals.
- Users who like clean interfaces.
It is not always as deep as some dedicated infographic platforms. But it is fast and easy. Sometimes that is exactly what you need.
How to Pick the Right Tool
There is no single best tool for everyone. The best tool is the one that fits your project, your skill level, and your deadline.
Use this simple guide:
- Choose Canva if you want the easiest all around option.
- Choose Visme if you need business ready visuals.
- Choose Piktochart if you want clear educational infographics.
- Choose Venngage if you need structured layouts and templates.
- Choose Adobe Express if you want stylish creative graphics.
- Choose Infogram if your project is full of data.
- Choose Napkin AI if you want to turn text into visual ideas.
- Choose Microsoft Designer if you want quick prompt based designs.
Tips for Making Better AI Infographics
AI can help a lot. But it is not a magic button. You still need a clear message. You still need good taste. You still need to check the facts.
Here are simple tips that work:
- Start with one main idea. Do not try to explain the whole universe.
- Use short text. Infographics are not novels.
- Pick three to five sections. More can feel crowded.
- Use icons carefully. Every icon should mean something.
- Keep colors simple. Two or three main colors are enough.
- Make numbers easy to read. Big stats deserve big type.
- Check AI text. AI can make mistakes. Be the boss.
- Leave white space. Empty space is not wasted. It helps people breathe.
A Simple AI Infographic Workflow
Want a fast process? Try this.
- Write your topic. Make it clear and simple.
- List the key points. Aim for five or fewer.
- Ask AI for a draft. Use a prompt with your audience and style.
- Choose a template. Pick one that fits the story.
- Add charts or icons. Make the content visual.
- Edit the text. Cut extra words.
- Check the flow. The eye should move smoothly.
- Export and share. Use the right size and file type.
Here is a sample prompt you can use:
“Create a professional infographic about five ways small businesses can save time with AI. Use a friendly tone, short headings, simple icons, and a blue and green color palette.”
That prompt gives the AI direction. It explains the topic, audience, tone, layout style, and colors. Better prompts usually mean better drafts.
Final Thoughts
AI infographic tools make design faster, easier, and more fun. They help you move from blank page panic to polished visual story. That is a big win.
If you are new, start with Canva or Piktochart. If you work with business content, try Visme or Venngage. If your project is packed with numbers, use Infogram. If your ideas are still messy, let Napkin AI help shape them.
The best infographics are not just pretty. They are clear. They are useful. They make people say, “Oh, I get it now.” And with AI on your side, that moment is much easier to create.