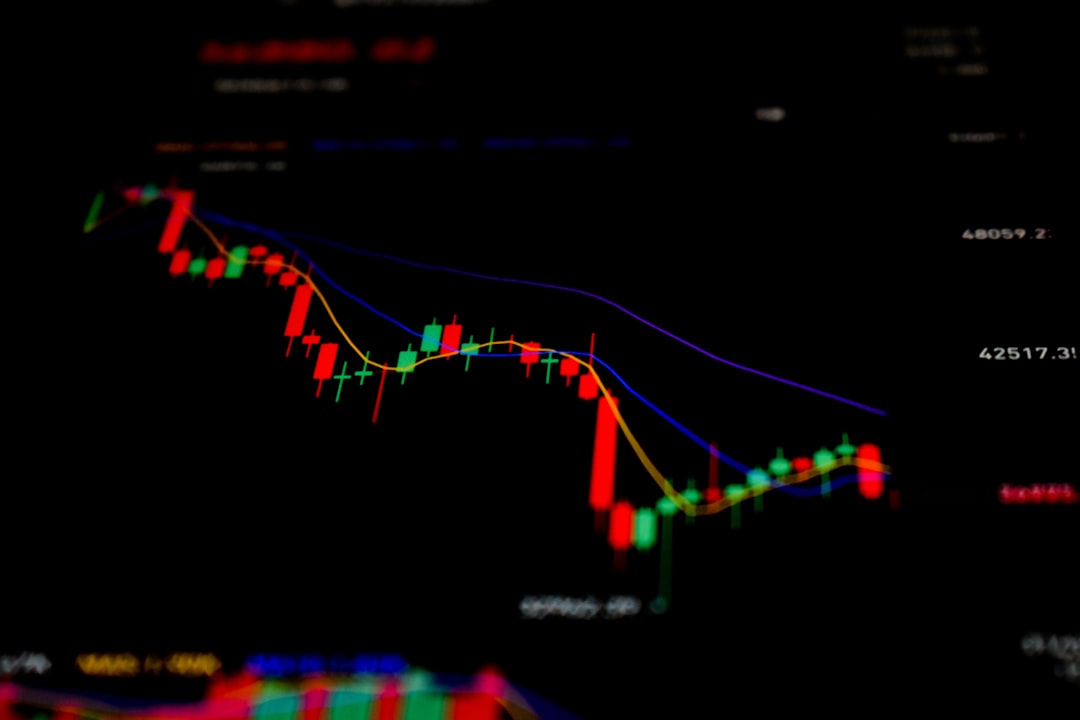
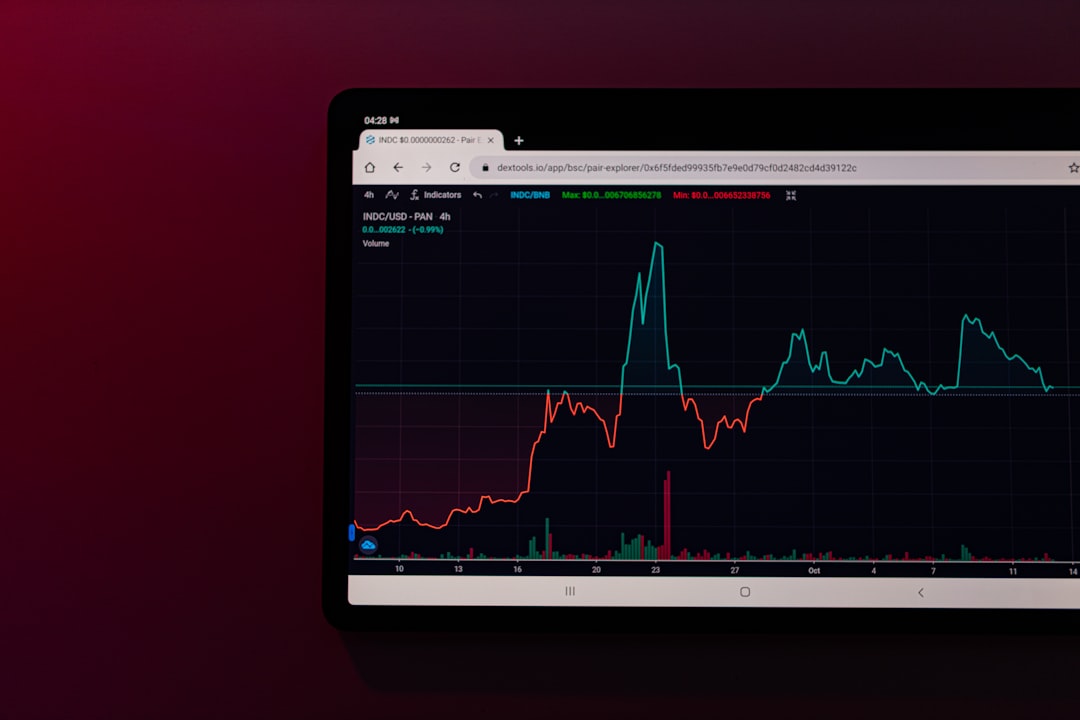
In the highly volatile world of cryptocurrency trading, staying ahead of market shifts is crucial. Unlike traditional markets, crypto operates 24/7, making it both a goldmine of opportunities and a potential pitfall for the unprepared. This is where technical analysis (TA) becomes an indispensable tool. By studying price charts and historical market data, traders can predict future price movements and make informed decisions.
Below are the 10 essential technical analysis tools every serious crypto trader should master.
1. Moving Averages (MA)
Moving Averages are among the most basic, yet powerful, tools in a trader’s arsenal. They smooth out price data by creating a constantly updating average price. The two most common types are:
- Simple Moving Average (SMA)
- Exponential Moving Average (EMA)
These indicators help identify the direction of the trend and serve as support or resistance levels. Traders often use a combination of a short-term and a long-term MA to create trading signals.
2. Relative Strength Index (RSI)
RSI is a momentum oscillator that measures the speed and change of price movements. Its values range from 0 to 100, and traders typically look for:
- Overbought conditions above 70
- Oversold conditions below 30
These signals indicate potential reversal points in the market.
3. Bollinger Bands
Bollinger Bands consist of a moving average and two standard deviations plotted above and below it. They are ideal for analyzing market volatility and price extremes.
A price touching or moving outside the bands often signals that the asset is overbought or oversold, prompting traders to consider a reversal.

4. MACD (Moving Average Convergence Divergence)
The MACD indicator helps traders spot changes in momentum. It consists of a fast EMA, a slow EMA, and a histogram. The key signals include:
- MACD Line Crossing Above Signal Line: Bullish signal
- MACD Line Crossing Below Signal Line: Bearish signal
This tool is especially effective when combined with other indicators like RSI.
5. Volume
Volume is the number of coins or tokens that have changed hands in a given period. High volume indicates strong investor interest and can validate price trends, while low volume can indicate weak momentum or the risk of a reversal.
Volume spikes often precede or confirm breakouts and breakdowns.
6. Fibonacci Retracement
This tool identifies potential support and resistance levels based on the Fibonacci sequence. Traders use these levels (23.6%, 38.2%, 50%, 61.8%, and 78.6%) to determine entry and exit points during retracements in an ongoing trend.
Fibonacci Retracement is especially helpful in volatile markets like crypto, where rapid price swings are common.
7. Support and Resistance Levels
These are horizontal lines drawn on a chart where the price historically reverses direction. Identifying these levels helps traders anticipate future price movements and set stop-loss and take-profit orders strategically.

8. Trend Lines
Trend lines are diagonal lines that connect a series of price points, indicating the general direction of the market. Uptrend lines connect higher lows, while downtrend lines connect lower highs.
Well-drawn trend lines act as dynamic support or resistance and help traders stay aligned with the prevailing direction of the market.
9. Stochastic Oscillator
This momentum indicator compares a particular closing price to a range of prices over a certain period. Values over 80 indicate overbought conditions, while values under 20 signal oversold conditions. It is especially useful during sideways or choppy markets.
10. Chart Patterns
Recognizing common chart patterns like Head and Shoulders, Cup and Handle, and Triangles can be extremely valuable. These patterns provide visual representations of market psychology and can lead to high-probability trading setups when confirmed by volume and other indicators.
In conclusion, mastering these 10 technical analysis tools can significantly enhance your ability to navigate the cryptocurrency market. While none of these indicators alone can guarantee success, they provide a structured approach to evaluating price action and market sentiment.
Successful traders often combine multiple tools to create a comprehensive trading strategy. Whether you’re a novice or a seasoned trader, understanding and applying these TA tools will improve your decision-making and help you stay ahead in the fast-paced world of crypto trading.
